


Black Swan Outlook
April 2025: Errare humanum est


In this Outlook, we deliver something of a primer to the analysis and forecasting of time-series. This is done to increase your understanding of the forecasts we are currently building on several key macroeconomic variables from China and the U.S. As usual, we provide forecasts for GDP growth and China's stimulus. In our monthly forecasts, we update China’s bank lending forecasts. In the Black Swan Outlook we concentrate on the policies of President Trump, which threaten to push the world into a deep conflict and into an economic depression.
GDP Forecasts
The controversy with the first quarter U.S. gross domestic product (GDP) growth forecasts, known as nowcasts1 has continued. Tuomas has written about this a few times (see this and this), which is why we don’t deal with that in any further detail here. We have our (first) answer on Wednesday, when the first estimate for U.S. Q1 GDP will be published.

Our updated nowcasts indicate that the U.S. economy would have grown by 0.1% during the first quarter. The economy of the Eurozone would have shrunk by 0.2%, while the economy of Finland would have seen a notable acceleration (we are rather skeptical of this figure, though). Our forecasts indicate that recession would commence in the Eurozone and in Finland in Q3 and in the U.S. in Q4. But, like we have been noting time and time again, uncertainty about the forecasts is very high. This, of course, also concerns the recession forecast.
Forecasts for the stimulus of China
Boom! The amount of money entering the Chinese economy grew by RMB 5.889 trillion in March (our forecast was RMB5.438 trillion). This is a new March-record with aggregate financing to the real economy, for example, growing by RMB4.867 last year (March of 2023 holds the previous March-record with a flow of financing of RMB5.385 trillion).
We have updated our forecasting model for the aggregate financing (see below). Our updated model currently estimates that the total flow of aggregate financing would reach RMB32.944 trillion this year. This is a notable drop from the RMB39 trillion, which was our last month’s forecast for the total flow of financing in 2025. This was mostly due to an error in our previous forecasts, which we explain in detail below.

The massive increase in the flow of financing into the economy in March was no surprise considering the heating up of the trade-war. It has been our stance since January that Beijing will stimulate heavily to keep the economy afloat during the trade-war. This implies that the actualized inflows can be considerably higher than our forecasts show. Stimulus flows are also heavily driven by political (and erratic) decisions. We discuss more of these in the Black Swan Outlook below.
Forecast of the month: Primer on time series analysis plus an update to forecasts of China’s bank lending
If you're not making mistakes, then you're not doing anything. (John Wooden)
Our first forecasts on the aggregate financing of the real economy of China, published in February and March included a critical error. Tuomas, who ran them, misread a crucial test result (it has been a while for him). Based on this, he assumed that the series of aggregate financing would be trend-stationary while in fact it was a random-walk. The dynamics of a random-walk series, also known as a unit-root process, are special in the sense that the estimation and forecasting of such a series require a specialized statistical model. Tuomas used a model not equipped to handle such stochasticity, which led to a biased forecast. In this section, we explain and correct his mistake and provide an updated forecast for bank lending in China. The corrected forecast on aggregate financing to the real economy was already presented above.
We start by explaining the basics of time-series analysis. We do this by going through excerpts from the last academic lecture (thus far) Tuomas held on the analysis of time-series in panel data at Tallinn University of Technology on 3-4 and 16-17 November, 2018.
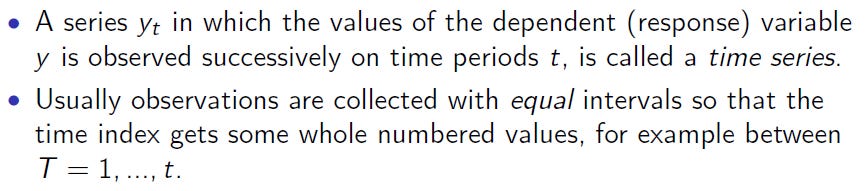
This just means to say that the time series analysis concerns consecutive observations collected through time on certain variables (like GDP, daily prices of a stock, or eggs a hen produces each week). Time series analysis is about analyzing the characteristics of that time series. The next excerpt is a bit more tricky, mathematically.
Keep reading with a 7-day free trial
Subscribe to GnS Economics Newsletter to keep reading this post and get 7 days of free access to the full post archives.