

This issue starts a new chapter in our Black Swan Outlooks. We will begin to utilize our statistical analysis and Black Swan narrative-building skills more extensively. The former launches a new section called Forecasts of the Month. In it, we provide monthly statistical forecasts on relevant economic and possibly even geopolitical variables. We will start by forecasting the development of the OECD's leading indicators, which we have been using to analyze and forecast the path of the world economy since September 2017.
We also have a long-standing tradition of looking at the worst-case scenarios, what we like to call "Black Swan hunting”. Our track record in anticipating these unlikely, high-impact events is rather impeccable. Since we started to truly look for them in 2017, no major event has surprised our customers. You can check our prior warnings from here, which include warning on Corona, the Russo-Ukrainian war, and the inflation shock. We will now deepen this analysis by providing an outlook for Black Swan events each month. We are not 100% sure what form this service will take, and so all your feedback is highly welcome.
Let’s start with the traditional GDP forecasts. They will accompany our outlooks also in the future.
GDP Forecasts
There has been quite a confusion with the first quarter U.S. gross domestic product (GDP) growth forecasts, known as nowcasts.1 Tuomas went through this controversy just recently. We have been using the Atlanta Fed nowcast as one of our nowcasting variables, providing an outside-model nowcast. Our forecasting model's nowcast for the U.S. effectively combines with the Atlanta Fed's nowcast. We will keep this form for now, but we do consider adding the New York Fed Staff Nowcast and the St. Louis Fed News Index Nowcast to our estimates. We will make decisions after we see how Q1 turns out with respect to different nowcasts.

Our nowcasts for Q1 indicate that the momentum of the U.S. economy would slow, but the economy would still grow at a semi-robust 1.6% annualized rate. The Eurozone economy would flirt with a recession during Q1, while the Finnish economy would grow robustly and then fall into a recession. All three would fall into a recession during Q3, like we have been anticipating. Uncertainty with the forecast continues to be high, though.
Forecasts for the stimulus of China
Looking to break a record. The amount of money entering the Chinese economy grew by RMB 2.238 trillion in February. This is a big jump from the previous year, when it only grew by RMB 1.521 trillion. Our model currently estimates that the total flow of aggregate financing would reach RMB 39 trillion this year. This would be a hefty increase from last year’s RMB32.35 trillion. This implies that Beijing would be pushing a record amount of stimulus into the economy during this year.

However, we are just at the second month, and the ‘mood swings’ of Beijing are well documented over the years. Yet, it continues to be our view that Beijing will continue to direct strong pulses of financing into the Chinese economy because of the trade war with the Trump administration and the uncertainty it brings. This scenario may not lead to a record stimulus, but it is likely to lead to a strong stimulus at least during H1 (the level of stimulus for the latter part of the year depends on what happens in the trade negotiations).
Forecast of the month: Leading indicators
We will initiate a new section dedicated to varying forecasts. We have notable statistical forecasting knowledge in our company, which we will put more into beneficial use henceforth. We will start this new section with forecasts on the (composite) leading indicators of the OECD.
They were the ones who led us into our original epiphany about the dominant role China has in the world economy. Our revelation was that China started to lead the world economy after the Great Financial Crisis (GFC). We discovered this from the OECD Composite Leading Indicators, presented in this figure (from May 1992 until February 2025).
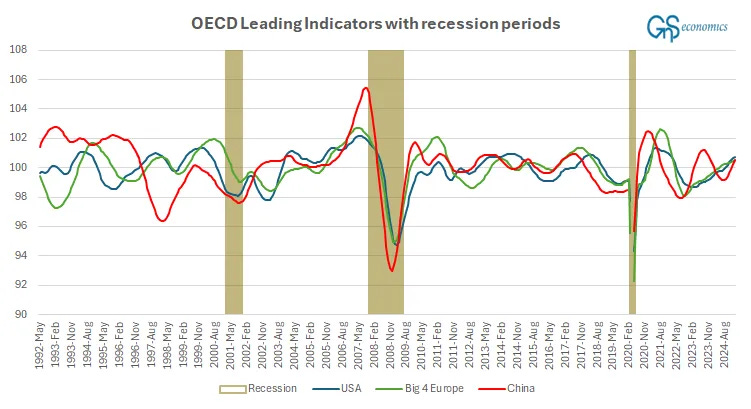
The leading indicators include a wide variety of economic and financial variables, which are considered to reflect the short-term outlook for the economy.2 What you can notice from the figure above is that after the GFC the indicators of the U.S. and the Big 4 in Europe seem to start to move where China’s indicators head, with a lag. Before Corona, we estimated this lag to be 2-4 months for Europe and 4-6 months for the U.S. Post-corona, something changed, like we explained in July. We also did some preliminary statistical analyses with the series, but did not turn them into actual forecasting.
We analyze the dynamics of the underlying series of leading indicators in a bit more detail now. We need to keep in mind that it takes time to build a robust statistical forecasting model, and the results we show here are just preliminary estimates. First we tested the forecasting power of the series against one another. We, rather unsurprisingly, found that all three series contain information that can be used to forecast the other series. In statistical terms, we found the series to Granger-cause one another.
We will not detail the specifics behind our time-series analysis, at least not yet, but just note that the testing revealed that the dynamics of the series can be reliably analyzed and their development forecasted using a standard Vector Autoregressive Model, or VAR. This is the forecasted development of the leading indicators for the next 12 months (until February 2026).
Keep reading with a 7-day free trial
Subscribe to GnS Economics Newsletter to keep reading this post and get 7 days of free access to the full post archives.