


Weekly Forecasts 17/2025
Forecasts on U.S. bank lending and inflation

Forecasts:
Updates to forecasts of U.S. bank lending.
Update to forecasts of commercial and industrial loans of U.S. banks.
Inflation forecasts for the next 12 months.
The forecasting conundrum (with U.S. bank lending)
During the past four weeks, we have been constructing time-series forecasts on variables determining the trajectory of our economies. We have concentrated on the leading indices of the OECD, non-performing loans of U.S. banks, main indices of the U.S. manufacturing sector, bank lending in China, lending of U.S. banks, and, lastly, inflation. The idea is to construct a comprehensive set of constantly updating forecasts mapping the way ahead for the world economy and markets. In this week’s Weekly Forecasts, we continue to take you deeper into the complex world of forecasting time series by updating forecasts on U.S. bank lending and inflation.
We at GnS Economics have long advocated that reliable forecasting of any economic phenomenon requires a proper command of statistics and the narrative. What we mean by this is that one simply cannot rely solely on statistical forecasts or narratives of future events to construct a reliable forecast. This applies especially now, when uncertainty in the world is the highest it has been for several decades (maybe even since 1945). Scenario forecasting is the way to tackle this uncertainty, which is based primarily on the narrative. However, we understand that many are looking for the consensus, i.e., the most likely path of events, to be able to incorporate these into his/her business, investments, or household budget planning.
We took forming the consensus forecast as the aim of our Weekly Forecasts when we reconsidered our service offering a few weeks ago. Getting to that point requires that we go through certain aspects of forecasting macroeconomic variables. We consider whether we should publish some mathematical explanations of the time-series analysis at some point, but for the time being we continue to present ‘real-life’ forecasts and the uncertainties they bring. We start with the forecasts on U.S. bank lending.
The first figure presents our forecasts for the annualized growth of loans and leases issued by U.S. commercial banks from last week’s Weekly Forecasts. We ran these forecasts by using the first differences of the lending series. This means that we subtracted two consecutive observations from each other (the older from the newer) throughout the data ranging until January of 1947. This was done to remove the unit root process, which was found to drive both the loans and leases series and the commercial and industrial (C&I) loan series. This changed the forecasts because it removed this stochastic trend process from the series. Simplified, one can think of the first-differencing as removing any time-trend driving the series from the forecasts. This is how those forecasts looked.
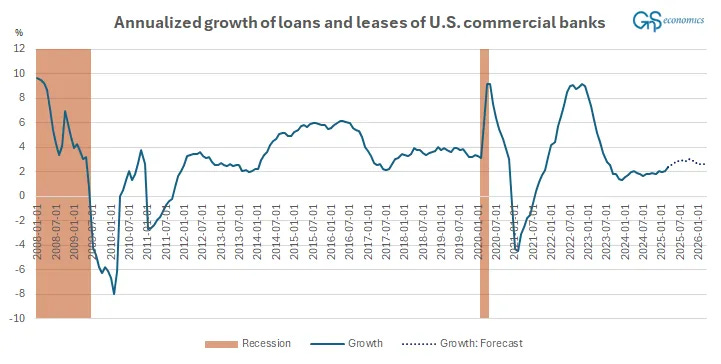
The forecasts using the stationary time-series indicate that the annualized growth of U.S. bank lending would first see an acceleration and then a deceleration heading into next year. The forecasts using first-differenced variables suggest that U.S. bank lending will initially recover slightly from its stagnation, but then stagnate again by next year.
With the updated forecasts, we took advantage of the cointegrating relationship found to exist between the two series of bank lending (see below for more). We utilized the Vector Error-Correction, or VECM, model to estimate the relationship and used that to construct a forecast based on the long-run dependency relation between the two variables. This changed the forecasts quite a bit, which now look like this.

Forecasts utilizing the cointegrating relationship indicate that U.S. bank lending will see a rapid recovery starting this month. One factor contributing to this result is the mean-reverting feature of time-series forecasts. This implies that the forecasts have a tendency to seek the mean of the series because it is the best (unbiased) forecast of where the series is likely to be in the future. The mean of the series between January 2008 and March 2025 is 4.16%.
We can argue that the forecasts constructed using the first-differenced series can be more accurate because they rely more on the short-term information of the series, while the forecasts utilizing the cointegrating relationship rely more on the (common) long-term trend driving the series. The forecasts using the first-differenced data also fit our narrative better. The information extracted from the yield-curve indicating that a U.S. recession is likely to commence during Q3 or Q4 also supports their result. So, at this point we trust the forecasts made with first-differenced variables more.
Forecasting the development of U.S. C&I loans
Keep reading with a 7-day free trial
Subscribe to GnS Economics Newsletter to keep reading this post and get 7 days of free access to the full post archives.