


Weekly Forecasts 14/2025
U.S. manufacturing and global economic indices

Forecasts:
Update on global economic indices.
What tale do manufacturing indexes tell about the U.S. economy?
Forecasts for the outlook of the U.S. manufacturing sector.
Economic indices of China and the euro area
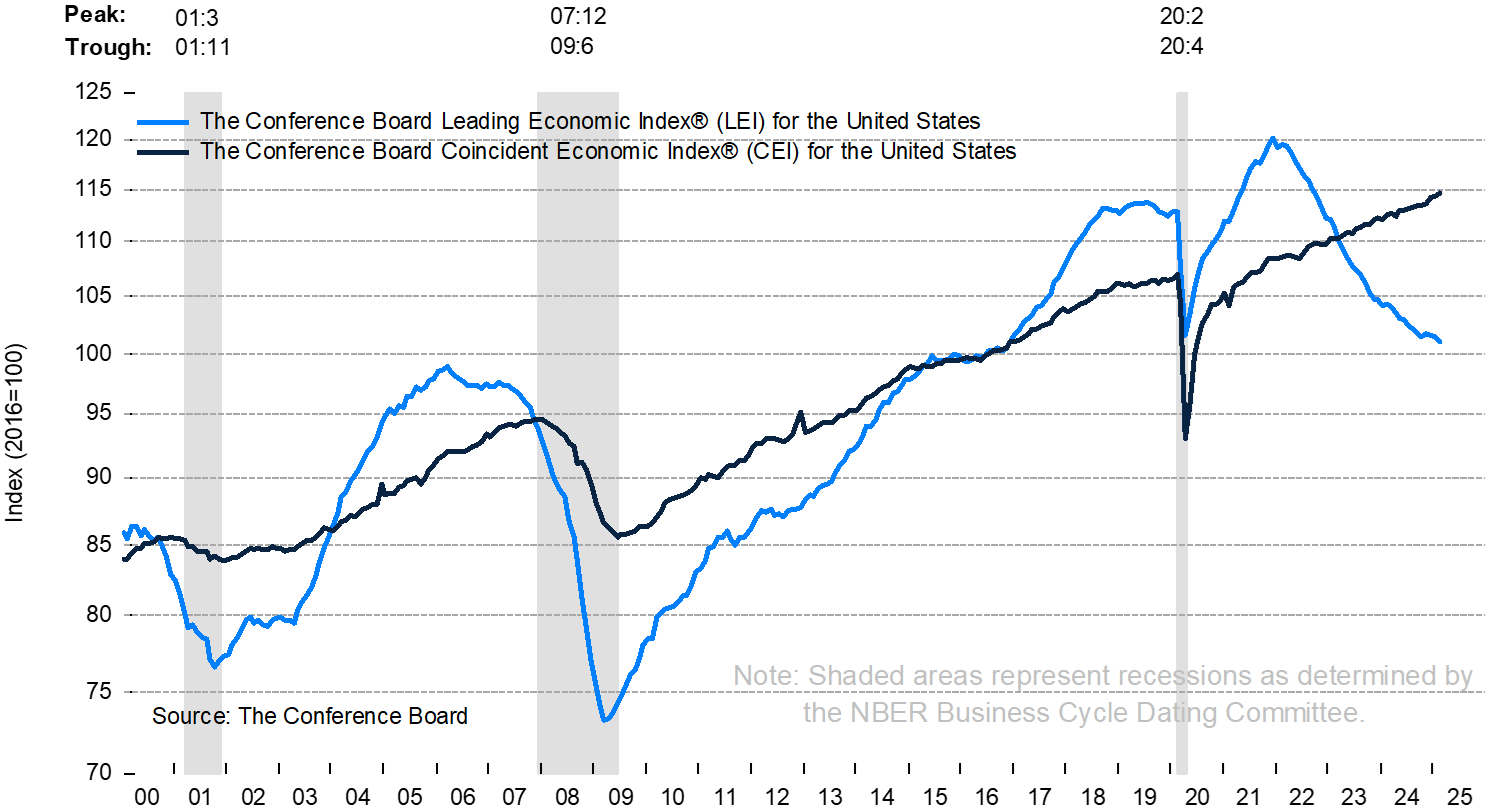
As noted in the February Black Swan Outlook, we transfer our reporting of the global economic indices to the Weekly Forecasts. We will devote at least two sections each month to the developments in China. Here we concentrate on the Eurozone and the U.S. We start with the U.S.; the Conference Board's consumer confidence index collapsed again in March. Furthermore, their leading indicator continues to head south. They are unlikely to improve this month due to the “tariff chaos” President Trump unleashed on Wednesday.

The purchasing managers index (PMI) of the Eurozone continued to improve in March, but it remains in contraction territory. The PMI of the service sector continued to fluctuate in expansionary territory.


The ifo Business Climate of Germany also improved. These improvements reflect the boost in stimulus in China, which commenced at the end of past year.

While improving, indices from the Eurozone and the U.S. continue to signal declining economic momentum. April figures, however, can see a collapse due to the trade war, which intensified today after China enacted heavy counter-tariffs of 34% on all imports from China. The big questions are, for how long will Beijing keep the stimulus going at current record-breaking levels, and how bad will tariff-wars get? We will deal with these questions in more detail next week.
Manufacturing indices of the U.S.
We will now start to present some of the economic indexes, which we previously reported in the Black Swan Outlooks, in graphs that also provide forecasts. We will start with manufacturing indices for the U.S. We construct two forecasts: one assuming no recession and the other assuming a recession. We will explain the process in more detail below.
We include four regions in our analysis. We use the manufacturing indexes gathered by the Federal Banks of Kansas, New York, Richmond, and Dallas (Texas). Here are their main indexes, which either show the production, a composite indicator of the most relevant variables of the respective manufacturing sector, or an indicator of business conditions. Indicators are presented as changes from the previous month.

Keep reading with a 7-day free trial
Subscribe to GnS Economics Newsletter to keep reading this post and get 7 days of free access to the full post archives.