


Weekly Forecasts 21/2025
U.S. bank lending

Forecasts:
The performance of U.S. bank lending forecasts.
Impulse-response analysis on U.S. bank lending and deposit-taking.
Forecasts for overall and business lending of U.S. banks.
This week we continue to develop our forecasting model for U.S. bank lending. We do this by including bank deposits in our forecasting model. This ends up creating more questions than answers, but it also provides us with a clearer path forward regarding this set of forecasts.
Like we have been noting, it takes about a year to build a set of reliable macroeconomic forecasts. This is because you have to check the validity of the models from actualized data. We have concentrated on building forecasts for global market liquidity, China’s debt stimulus and bank lending, global leading indicators, U.S. manufacturing, and U.S. bank lending. These variables have been selected because they are crucial for mapping the road ahead for the world economy. We are making good progress and will add variables when our resources grow. Mate will submit his Master’s Thesis by the end of the month, after which he will take a larger role in building forecasts for the U.S. banking sector. To note, we hope that in the near future, we can use AI to help us to expand our forecasting offering. At the current time, AI is not “intelligent” enough to be used to construct (reliable) time-series forecasts simply because they are something of an art form. Yet, I am sure that it will be able to assist in building them shortly.
Our updated forecasts indicate that the U.S. credit recession would be ending, which contradicts our current recession call. Because of the uncertainty that still haunts our forecasts on U.S. bank lending, we do not alter our recession call (onset of U.S. recession between Q3 and Q4) yet.
Tuomas
Performance of U.S. bank lending forecasts
We now start to follow the performance of our forecasts on U.S. bank lending as we developed them further. This week we add deposits into our forecasts, which look to improve the efficiency of our forecasts. Note that we will explain the dynamics of cointegration in more detail in this month’s Black Swan Outlook (also known currently as the time-series analysis lecture—Outlook ;)).
A month ago we conducted our first forecasts using the cointegration relationship discovered to exist between the loans and leases and commercial and industrial (C&I) loan series of U.S. banks. There was a notable difference between the forecasts conducted using variables in first-differences versus in levels (the former means that we deduct the previous observation of the variable from its following observation).1 The two forecasts yielded differing results, with the forecasts utilizing the cointegration relationship showing a notable acceleration in the growth rate of loans and leases and the volume of C&I loans issued by U.S. banks, while forecasts run using first-differences indicated that the growth rate would stagnate. We noted:
We can argue that the forecasts constructed using the first-differenced series can be more accurate because they rely more on the short-term information of the series, while the forecasts utilizing the cointegrating relationship rely more on the (common) long-term trend driving the series. The forecasts using the first-differenced data also fit our narrative better.
Today, we present the first pieces of information indicating our interpretation of the results was wrong. This figure presents the actualized vs. forecasted annualized growth rate of U.S. loans and leases.
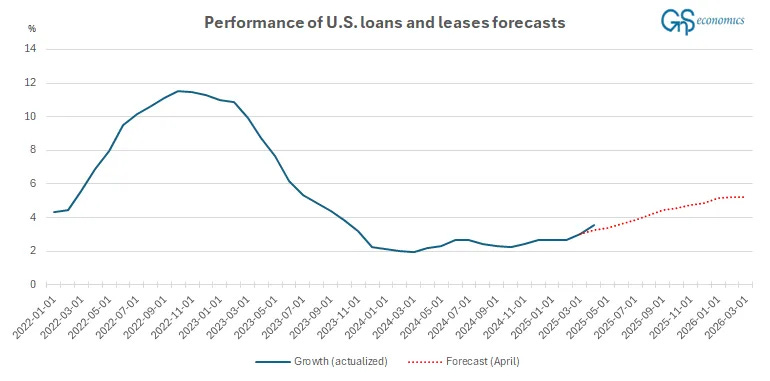
The figure shows that the year-over-year growth rate of loans and leases issued by U.S. banks grew faster in April than what our forecasts indicated. The total value of loans and leases in April was $12,815 billion, while our forecasts (with March data) indicated that it would be $12,777 billion, with a 95% upper confidence interval at $12,822 billion. So, our point-estimate (forecast) was off by $38 billion in April, but the actualized value was within the 95% confidence interval of our forecast. How did our forecast for C&I loans perform?
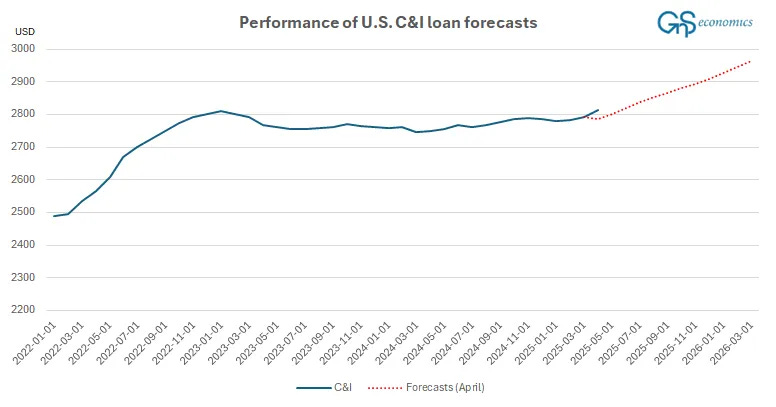
They were also off, to the downside. The amount of C&I loans issued by U.S. banks grew to $2815 billion in April, while our forecast indicated they would have grown to $2787 billion. The upper limit of the 95% confidence interval of our forecasts was $2809 billion. Thus, the actualized volume of C&I loans broke the (95%) confidence intervals of our forecast. This implies that A) there was a notable acceleration in the loan issuance and thus business activity in the U.S., B) that we should use variables in levels in our forecasts, and C) that our forecasting model lacks some important information because it failed to correctly anticipate even the one-step (one-month) development of C&I loans. Next we turn to improving the latter.
Impulse-response analysis of deposits and loans of U.S. banks
In the August World Economic Outlook, Mate explained the role of core deposits in the lending of banks.
This sharp decline in cash was largely due to a reduction in core deposits, which serve as a primary source of funding for banks. […] This decline in core deposits, which has been ongoing for some time, is critical for banks. As their cheapest source of funding diminishes, banks are increasingly relying on more expensive alternatives to sustain growth.
What we mean by “cheapest source of funding” is that core deposits are something that households and SMEs (small and medium-sized enterprises) want the banks to keep,2 i.e., they lend that money to banks with the lowest possible rate of interest. This implies that, at least, core deposits affect the lending capacity of banks. We do not currently hold a long enough series on core deposits for a time-series analysis. This is why we use the deposits held by commercial banks. Tuomas has explained the differences between different deposit series in his newsletter. This is how the three series look.
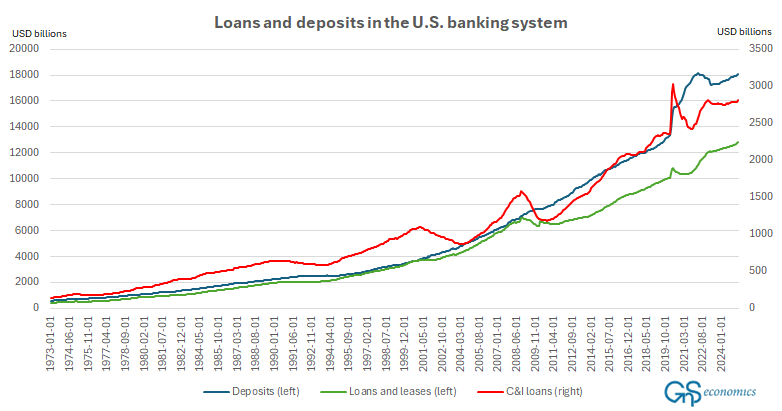
They, unsurprisingly, seem to move through time in sync. But what does time-series analysis reveal about their relationship?
First, we discover that all three series are random walks with drifts. This means that the series are driven by a stochastic trend around a time-trend. That is, there are both stochastic and non-stochastic trends affecting the series. This is something we need to take into account in our analysis.
Keep reading with a 7-day free trial
Subscribe to GnS Economics Newsletter to keep reading this post and get 7 days of free access to the full post archives.