


Weekly Forecasts 19/2025
Update to the forecasts of the U.S. manufacturing sector

Forecasts:
Recent developments in the U.S. manufacturing sector.
Forecast comparisons.
Impulse-response analyses and forecasts for the U.S. manufacturing sector.
As a part of our efforts to build a comprehensive global network of forecasts, we have been constructing forecasts for the U.S. manufacturing sector. In this report, we reflect on our forecasts from the past month and continue to experiment to discover the best (most efficient) variables for forecasting developments in the U.S. manufacturing sector, a major component of the U.S. economy.
A month ago, the problem we discovered was that there was no uniform measure of manufacturing production gathered by the regional Federal Reserve Banks of Dallas, Kansas, New York, and Richmond, our main regions of interest at the moment. Therefore, in this report, we analyze the index of shipments related to manufacturing production, which is collected by all four regional Federal Reserve Banks in their surveys. We analyze the effect of new (manufacturing) orders on it and, unsurprisingly, find that new orders drive the shipments series. This finding adds to the efficiency of our forecasts. Our forecasts imply that the stagnation of the U.S. manufacturing sector and thus the U.S. economy would continue.
A look at the U.S. manufacturing
This is how the main manufacturing indexes look at Dallas (Texas), Kansas, New York, and Richmond Fed manufacturing surveys. To note, the index of Texas is the only production index, while others measure business conditions (N.Y.) or gather several manufacturing indices (composite).

There clearly is no slump visible in the indexes, but something of a stagnation. Average indexes give a more concise picture. In the figure below, we add the average of new orders into our analysis.
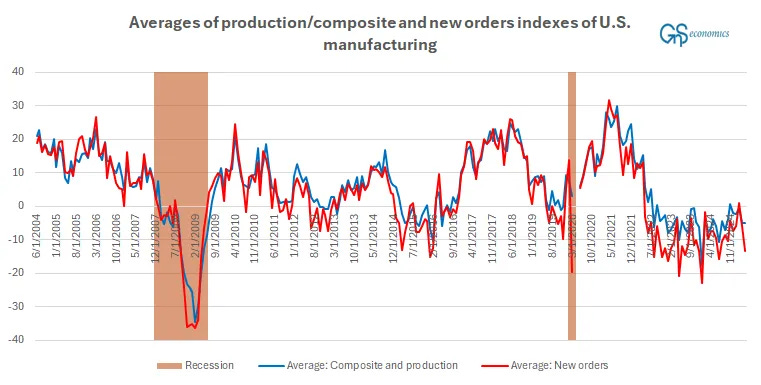
Both indexes are clearly in the stagnation territory, while the new orders index is flirting with recession territory in its recent downward spikes. The problem we have with the “aggregate” indexes is that they are not commensurate. Others measure production, while others gather several sub-indices into a “composite” index. To make indexes comparable, and also to make our statistical forecasts more robust,1 we replace the aggregate indexes with the index of manufacturing shipments. This is how its series looks (with new orders).

Based on all three figures, the U.S. manufacturing sector is experiencing a stagnation (not a slump). The average of the new orders index has exhibited quite a noticeable volatility, especially during the last three years. We are interested in the forecasting ability of this series regarding the development of U.S. manufacturing. New orders naturally drive manufacturing, but it is unclear how far into the future their impact reaches. Before analyzing that, let’s first check how our forecasts of the past month fared.
Forecasting U.S. manufacturing: a check-up
This is how our forecasts for the production and composite indexes fared in April.
Keep reading with a 7-day free trial
Subscribe to GnS Economics Newsletter to keep reading this post and get 7 days of free access to the full post archives.