
Weekly Forecasts 19/2026
Recession is here? Forecasts for the global business cycle dive

Contents:
OECD’s leading indicators show a slowing down of the European economy, while China re-accelerates.
Our forecasts indicate an imminent onset of a downturn in the global business cycle, which has the potential to morph into a global depression.
It looks like we have entered a turning point. Despite the recent cautious optimism with regard to the U.S. economy, our forecasts paint a gloomy picture for the world economy going forward. More precisely, even our standard forecasts, assuming no crisis, paint a picture of the global business cycle heading down steeply from henceforth.
This is naturally no surprise, considering the economic hit manifesting from the Middle East, which is now progressing at an increasing speed. Moreover, our oil crisis scenario forecast presents a warning of a collapse of the global economy. It indicates that in just 12 months (this one included), the global downturn would reach the depth of the Great Financial Crisis. I consider this scenario to be worryingly likely.
Western economies are dangerously exposed to the economic hit emerging from the Middle East. This applies especially to Europe, but also to the U.S., like we saw just yesterday. I would take heed.
Tuomas
An update to the leading indicators
Latest updates to the OECD’s leading indicators present an acceleration of the global economy and include smallish revisions to the indicators we have been monitoring. Our oil crisis scenario forecasts correctly anticipated the uptick in both the global and U.S. business cycles but missed the strength of the Japanese economic momentum. Our updated forecasts indicate that a global downturn is upon us.
Let’s start by looking at the recent developments in the grand scheme of things. Figure 1 presents the long time series for China, Japan, four major European nations (France, Germany, Italy, and the U.K.), the G-20 countries, and the U.S. from May 1992 until April 2026.1
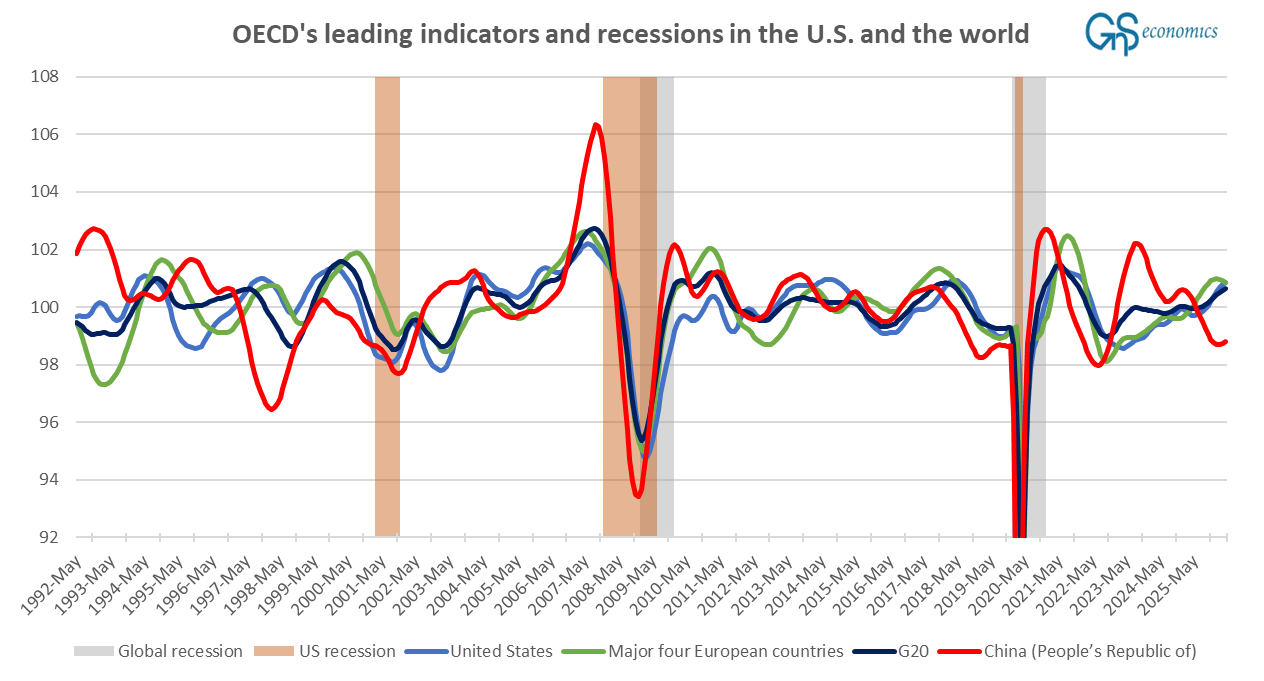
The updated (and revised) indicators show three major developments. First, the leading indicator of China has turned upwards from a relatively low level, indicating a recovery of the Chinese economy. Considering the major stimulus push enacted by Beijing during the first months of the year, this is no surprise. Secondly, the leading indicators of both the G-20 and the U.S. keep on heading upwards, signaling a strong economic momentum. Thirdly, the strong upward momentum of the indicator of four major European nations has broken. Figure 2 provides a more detailed look at the recent developments, including the indicator for Japan.
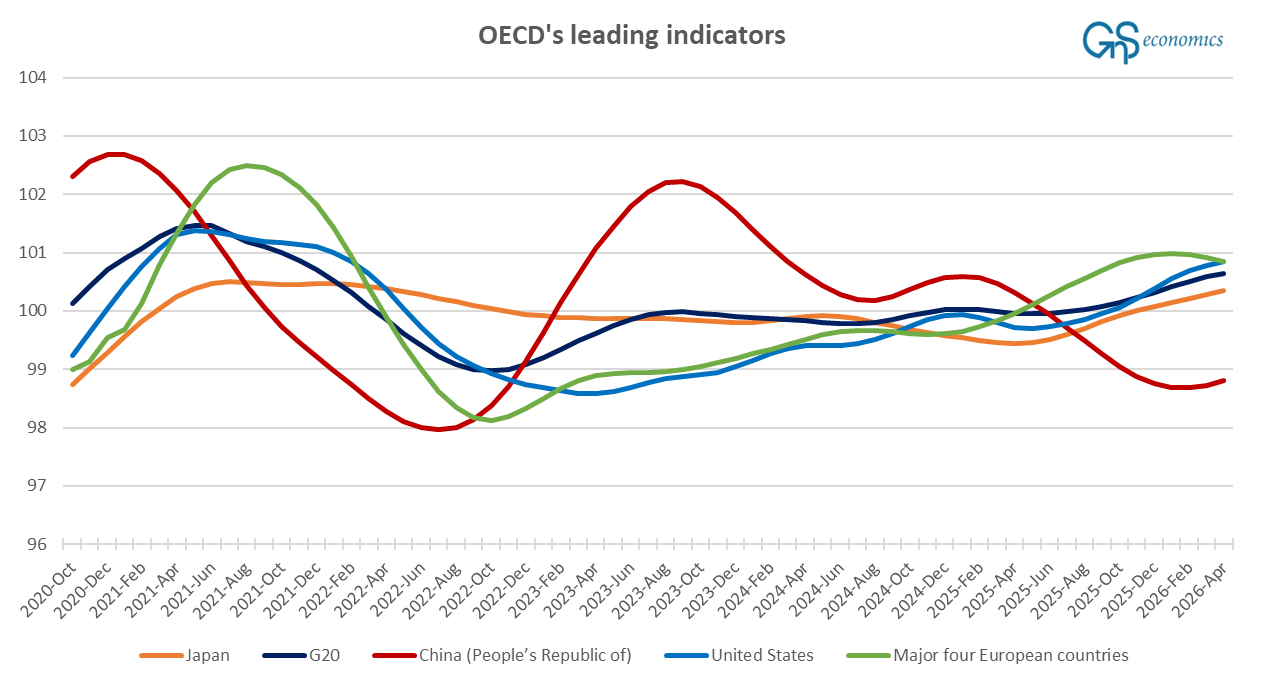
From Figure 2, the turning point in the indicator of the major four European economies becomes clear, like the upturn in China’s (revised) indicator. The continued upward momentum of the G-20, Japanese, and U.S. economies is also clearly visible.
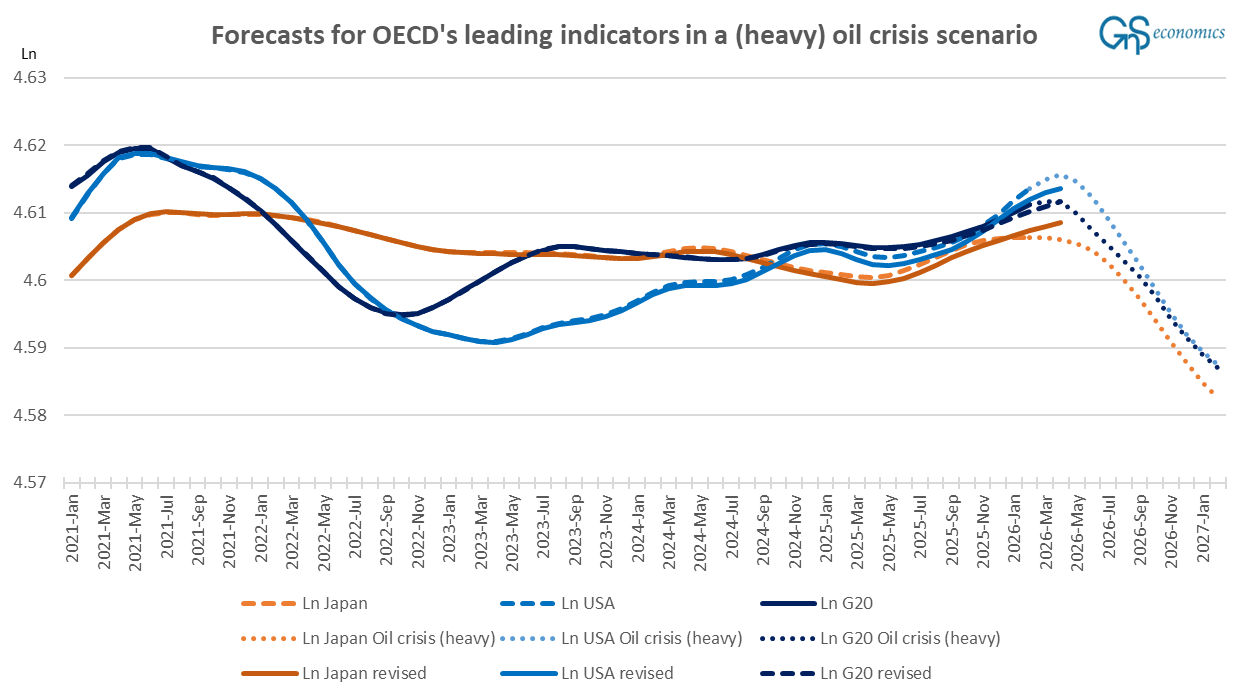
What we can deduce from the above is that 1) the downturn of the European economy, which we noted last week, has commenced and 2) that the global economic momentum continues strong still, likely helped by the major stimulus from China. Figure 3 presents our beginning-of-April forecasts run with data that reached February and the revised actualized value of the leading indicators of the G-20, Japan, and the U.S.
Forecasts: A global downturn is upon us
We apply a similar model setup in our forecasts as we did in the beginning of April. We use the vector autoregression, or VAR, model, and the values of the OECD’s leading indicators of the G-20, Japan, and the U.S. enter in their natural logarithms. We use (natural) logarithms to smoothen the probability distribution of the volatile leading indicator series.2
At this point it looks like we are not heading into a “mild” but a “heavy” oil crisis. Our mild oil crisis scenario assumed that the conflict would have been solved by the end of last month. This obviously has not happened, as the Strait of Hormuz remains under “smart control” of Iran. There’s also no endpoint of the conflict in sight currently, because the views of Iran and the U.S. are so far apart. This also implies that the risk of the conflict re-erupting remains high. This is why we use the heavy oil crisis scenario from early April as a basis for the structure of the dummy variables.
Figure 4 establishes a baseline by presenting the forecasts of our model in a standard, i.e., in a no- oil crisis scenario. Contrary to our previous forecasts, even the standard model now sees a major global downturn dead ahead.3
