

U.S. inflation came in hot today. I wanted to immediately check how my forecasts had fared.
Before we go there, a smallish correction to my yesterday’s piece. I had inserted the first figure presenting the weekly growth rate of U.S. M2 money behind a paywall. This was not my original intention. I changed it today, and so also my free subscriber can “marvel” at the strength of the bailout of the U.S. financial system.
Let’s now examine how my ceasefire scenario forecasts for U.S. inflation performed in April. Figure 1 presents them with the actualized month-over-month growth rates of U.S. inflation indices.
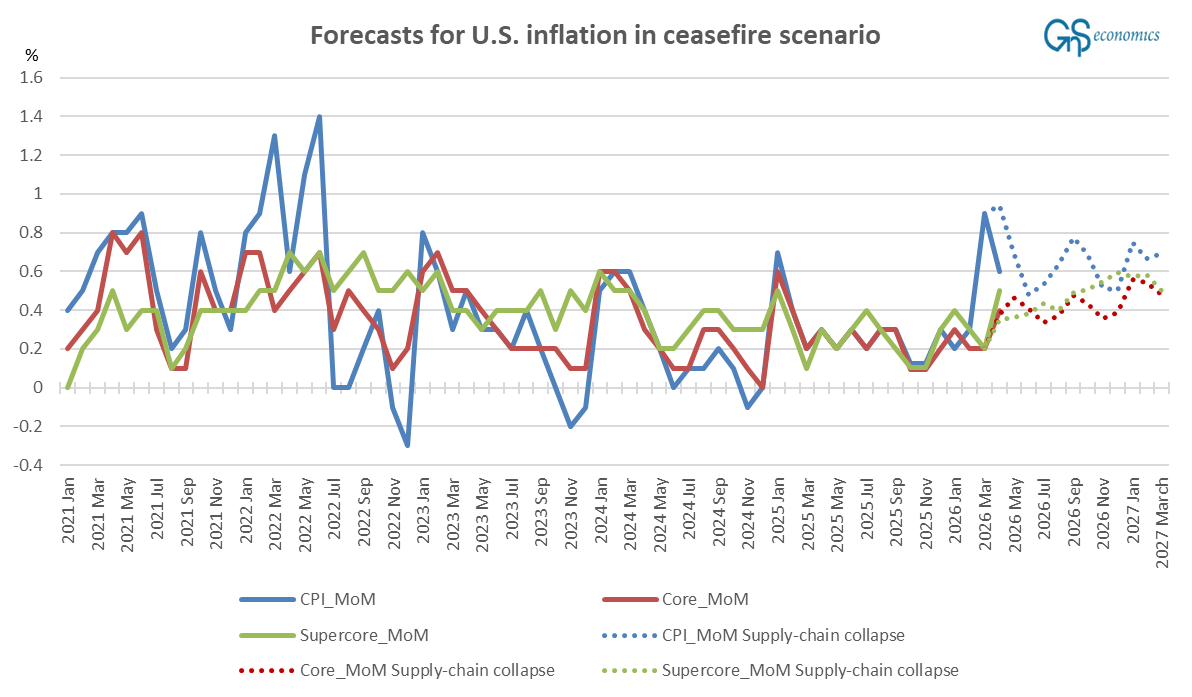
My forecast foresaw the U.S. Consumer Price Index (CPI) to increase by 0.9% month-over-month in April, but the change was 0.6%. The forecasted growth rate of core inflation was 0.37% (= 0.4%), and the realized value was 0.4%. The forecasted growth rate of super-core inflation was 0.35% (= 0.4%), and the realized value was 0.5%. Except for the clear miss on CPI, my forecasts were rather accurate.
Scenario forecasting is 80% art form because you have to select the magnitude of the dummies (and the model does the rest, i.e., estimates the model and produces the forecasts). I used both oil crisis and supply chain collapse (first Corona lockdown) dummies under the following assumptions:1
I insert the dummies in a way that the oil crisis reaches its highest value (0.8) in August, while the supply-chain collapse dummy reaches its highest value (0.6) in September. These are to indicate that the U.S. would witness 80% of the effect of the early 1970s oil crisis and 60% of the effect of the Corona shock (in the spring of 2020) at maximum.
Let’s see how these fare in the coming months, as the main purpose of scenario forecasts is to model the medium-term path. We’ll be updating the inflation forecasts in next week’s Weekly Forecasts.
The problem the Federal Reserve is facing is this.
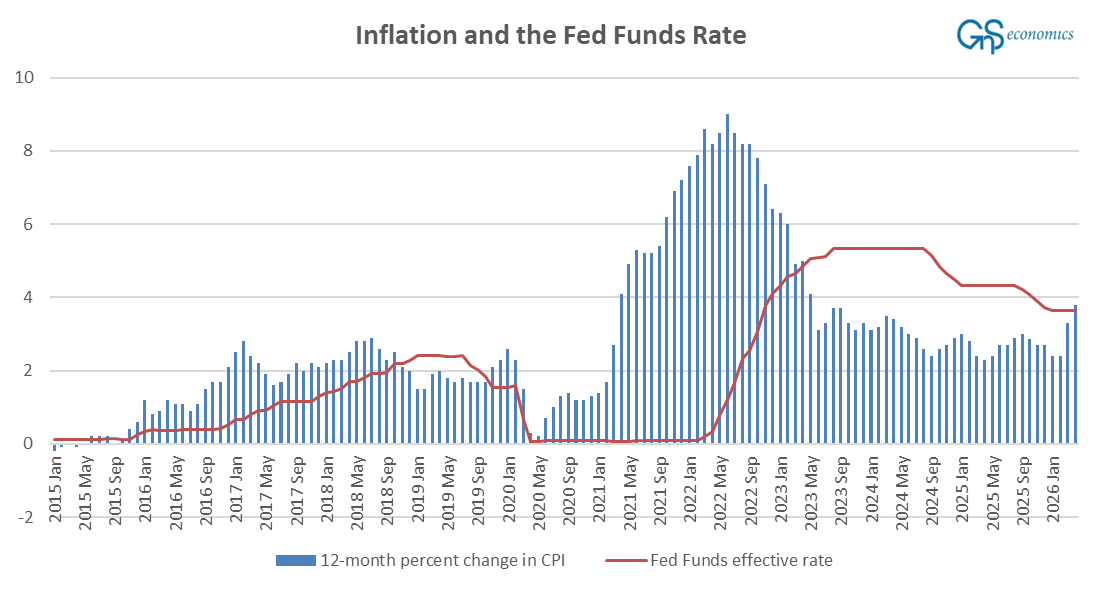
The rate of U.S. inflation (12-month % change of CPI) has reached the Fed Funds Effective Rate again, and it is not going to go down for a while. I explained the inflation pressure rolling in from the Middle East (Strait of Hormuz) in the U.S. inflation in a ceasefire:
Moreover, even if the Strait were fully opened tomorrow, it would still take months for the flow of tankers to normalize and the damaged production to come online. In other words, energy shock will come, regardless.
The U.S. also needs to export certain types of oil for its refineries, including heavy oil, jet fuel, diesel, and gasoline, which account for over 6% of the total imports. The U.S. naturally imports several other petrochemical and non-petrochemical products, such as plastics, fertilizers, and chemicals, which further contribute to its reliance on global markets.
And there’s nothing, nothing, that the administration of President Trump can do to stop this. They should have left the war “yesterday,” but even if they did so now and the Strait opened tomorrow, the energy shock would still come. The simple fact is that the longer the stalemate in the SoH continues, the worse the coming shock will be.
You can forget about the rate cuts or even holds. Rate hikes are coming, and the U.S. economy will fall into a stagflation.
Tuomas
Caption of Figure 2 added post-publication on 5/12/2026.
Disclaimer:
The information contained herein is current as of the date of this entry. The information presented here is considered reliable, but its accuracy is not guaranteed. Changes may occur in the circumstances after the date of this entry, and the information contained in this post may not hold true in the future.
No information contained in this entry should be construed as investment advice nor advice on the safety of banks. Neither GnS Economics nor Tuomas Malinen can be held responsible for errors or omissions in the data presented. Readers should always consult their own personal financial or investment advisor before making any investment decision or decision on banks they hold their money in. Readers using this post do so solely at their own risk.
Readers must assess the risks and legal, tax, business, financial, or other consequences of their actions. GnS Economics and Tuomas Malinen cannot be held i) responsible for any decision taken, act, or omission or ii) liable for damages caused by such measures.
The views of Tuomas are his own. They may or may not be endorsed and supported by the partners and staff of GnS Economics.
