


Weekly Forecasts 11/2025
Liquidity

See also our individual service for Weekly Forecasts.
Forecasts:
China continues to dominate the global market liquidity. (Free)
Global money supply (market liquidity) forecasts.
What is happening to global liquidity, and markets?
The breath of the (liquidity) dragon
Update on the global money supply (liquidity) data has arrived, and it’s an interesting package. Our market liquidity forecasts continue to indicate that we would be in the midst of a strong (global) liquidity injection, even though it does not look like that in the markets. Markets look to be in something of a cross-roads, which we will discuss at the end, where we also provide a warning of a possible market Black Swan event.
Let’s first corroborate our hypothesis of an exceptional October. This figure shows the liquidity injections and withdrawals (draining) by China from January 2016 till January 2025. It shows just two injections for October: 2016 and 2024.
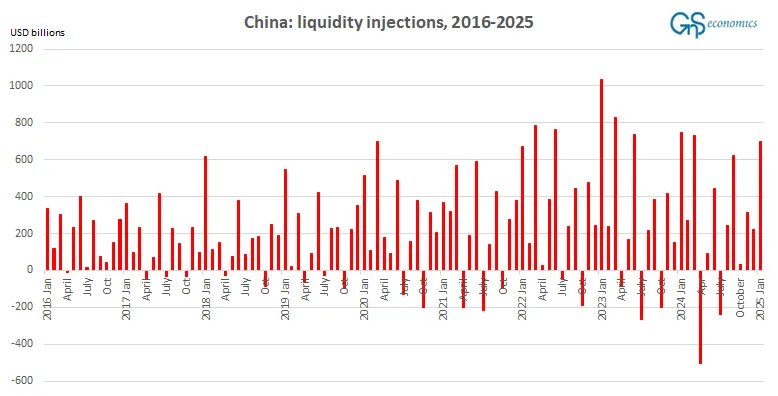
Thus, liquidity flows from China saw their first injection in October since 2016, and injections continued strong in November and December. It’s thus no surprise that markets kept on rallying through the year-end.
Essentially, money (liquidity) is created, when commercial banks extend credit to households, corporations and governments (local and federal). Also central banks can add liquidity into the circulation through QE-programs and different liquidity operations directed to banks (see, e.g., the Bank Term Funding Program of the Federal Reserve). Liquidity is removed from circulation, when loans are paid back to banks, when central bank enacts a QT-program or banks pay back their emergency loans to the central bank.
Like we noted past week, it’s unclear to us, why there’s so massive seasonality in the financial flows of China (which naturally applies also to money supply). October has been a month of liquidity draining for a decade and that’s just how it is, except in 2024 it was not. The reason, why it was not, were the emergency measures taken by the People’s Bank of China (PBoC). There were liquidity injections from other regions in October as well, shown in the next two figures.
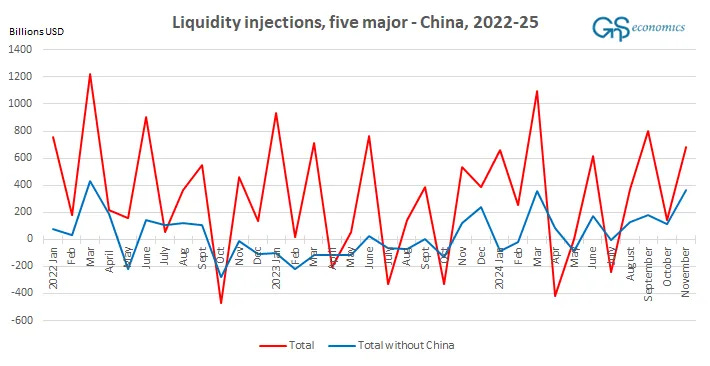
To dissect the flows a bit, there was a liquidity draining from Japan, where the Bank of Japan has been rising its interest rate for the first time in since the GFC. All other regions added liquidity into their respective systems in October and in November. Yet, what is clear from the figures above and below is that China dominates the global liquidity landscape, like we have been noting for over two years,.
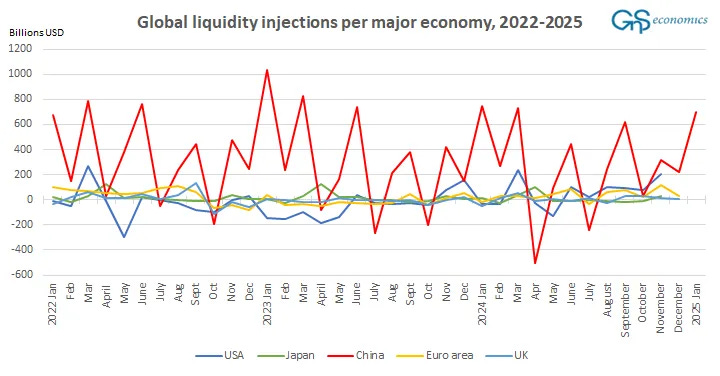
If the Chinese economy would ever face a collapse, repercussion to the world economy, and global financial markets, would be nothing short of cataclysmic. This is something many analysts not truly understands. During the period running from November 2023 till November 2024 China has injected $3322 billion worth of liquidity into the global financial system, while the euro area, Japan, the U.K. and the U.S. have injected €4885 billion combined. This shows the utter dominance of China in providing market liquidity. It truly is a (liquidity) breath of a dragon.
Forecasts for market liquidity for H1 2025
Yesterday, Tuomas updated his piece on the Fracture lines in global finance. It showed a continued (and worrying) decoupling of cross-border and local foreign currency bank lending and debt issuance, which de facto stagnated post-Corona. At the end of his yesterday’s piece, Tuomas speculated that we could have entered another period of declining international credit issuance, i.e., global liquidity. He may be onto something. Measured from our dataset, the mean annualized growth rate of money supply was 6.9% pre-Corona (2010-2019), while it was 3.81% in 2024 (Jan-Nov) and 3.97% in 2023 (note that the difference between 2024 and 2023 can be due to missing December in the former). We comment this more below.
What are the forecasts with updated data telling us about how global liquidity will develop in the coming months? We have full data only till November, so this forecast runs from December 2024 till may 2025.
Keep reading with a 7-day free trial
Subscribe to GnS Economics Newsletter to keep reading this post and get 7 days of free access to the full post archives.