


Time-series forecast update
Where the leading indicators lead

From Tuomas Malinen on Geopolitics and the Economy.
I took a break from here yesterday to concentrate on forecasting. This week I am responsible for both the Weekly Forecasts and the Black Swan Outlook of GnS Economics, as Mate is finishing his Master’s Thesis. So, this week will be full of (time-series) forecasting, and I thought, what would be the better way to start it than to toss about with our failed forecasts? ;)
Well, in all honesty, the Weekly Forecasts and the Outlook are so stuffed with analysis, I thought I'd present the performance of our forecasts for leading indicators here. Moreover, you are rarely able to produce reliable forecasts at the first try, but it’s a process where failures teach you (if you heed them). So, today we are going to concentrate on our (time-series) forecasting failures, and I will report one new forecast arising from these failures.
In this week’s forecasts, we concentrate on the leading indicators of the OECD. We’ve been modeling the development of the leading indicators of China, four major European countries (France, Germany, Italy, and the U.K.), and the U.S. since March. The leading indicators have actually been our guide in understanding the turning points of the world economy for many years, but we took up forecasting them only in March.

Since around 2009, China has been "leading" both the Major-4 Europe and the U.S. leading indicators. This implies that where the index of China goes, others tend to follow (see more from the Weekly Forecasts). The Great Financial Crisis and first Corona lockdowns are also clearly visible in the series. What should also catch your eye is the heavy fluctuation in the leading indicators after 2020. A post-covid bottom occurred in the indices around summer 2022, followed by a rapid acceleration, especially in China's index. 2023 was the year when Beijing enacted a major resuscitation. The past few years have seen some drastic occurrences and heavy fiscal and monetary stimulus, which explains the fluctuation.

Below you see a comparison of our March and April forecasts for the leading indicators. The figure shows that our previous forecasts have not been very accurate. Especially the forecasts for China were seriously off.
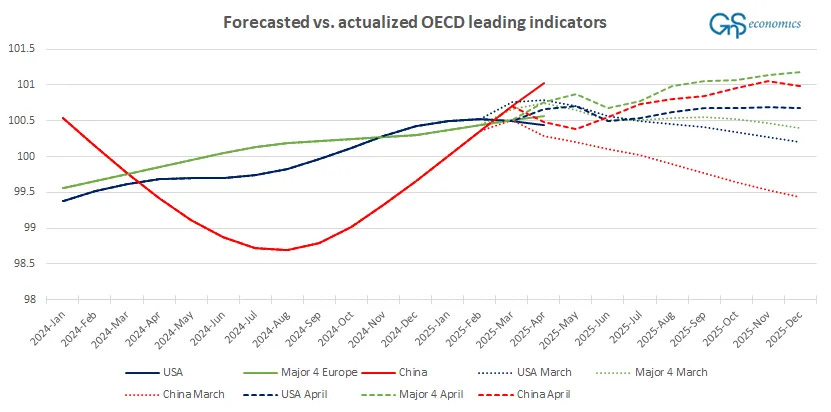
While the forecast for China’s leading indicator missed to the downside, forecasts for Major-4 Europe and the U.S. leading indicators missed to the upside. That is, our forecasts expected a slowing economic momentum for China and accelerating momentum for Major-4 Europe and the U.S. So, there’s quite a bit of room for improvement, and that’s what we’re aiming at.
It takes about a year to construct reliable time-series forecasts with monthly variables, because you have to learn more about the data you’re using, determine the most effective forecasting model, and wait for the actualizations to adjust your forecasts. This, quite simply, takes time. We are right in the middle of this now in GnS Economics. This also means that these forecasts will “spill over” also to here. I am betting none of you will mind.
I will end with our updated forecasts. This is how our model currently sees the leading indicator of China developing during the next 12 months.
Keep reading with a 7-day free trial
Subscribe to GnS Economics Newsletter to keep reading this post and get 7 days of free access to the full post archives.