Nowcasts
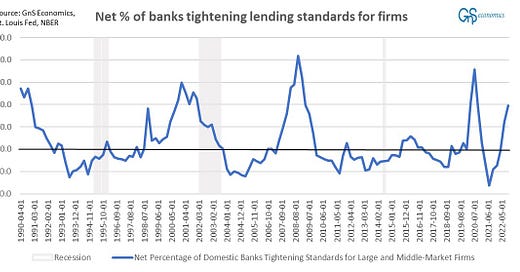
(GnS Economics, OECD, Q-to-Q): The arrival of a recession to the U.S. starts to look very likely. Latest signal on this are the tightening lending standards of banks. So, while nowcasts for Q4 2022 still show a decent growth for the U.S., it is likely to turn to negative during the first two quarters of 2023.
Based on our model, Eurozone has already fallen into a recession, but Finland would have seen her GDP grow during the last quarter.
This time around we do not present quarterly forecasts for the growth of real GDP, but concentrate on the annual scenario forecasts (see Scenario Forecasts). Our each scenario does find, however, that the U.S., Eurozone and Finland will fall or already be in a recession during Q1 2023 (the U.S. with a slim margin though).
China stimulus
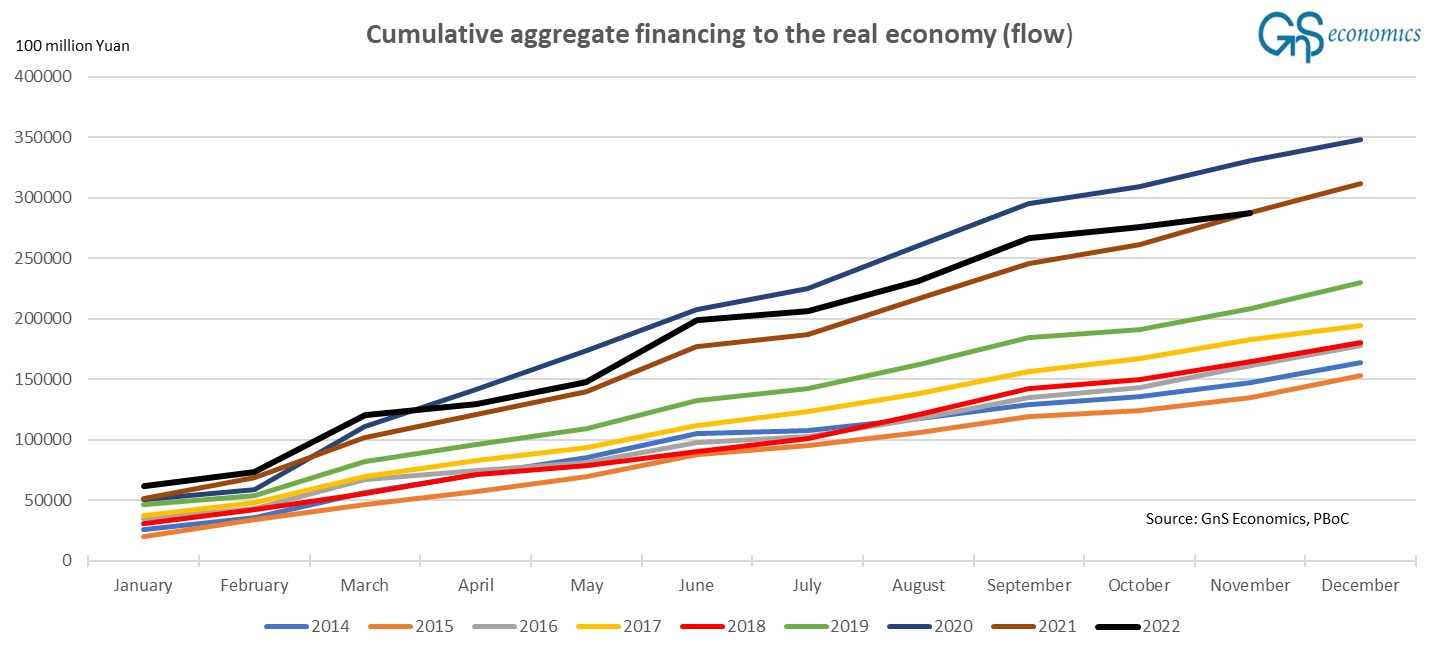
The aggregate financing to the real economy continued to diminish in November. Now, Beijing vows to launch another stimulus round as draconian Covid policies seem to be at an end.
We have seen this before, as this is the third time Beijing is talking “tough” on the economy during the course of the year. Thus, we simply have to wait and see what comes. It should be noted, though, that the slowing down of stimulus in October and November is likely to become visible in economic indicators, especially in Europe, during January and February.
ECONOMIC INDICATORS
United States, December (November)
Richmond Fed manufacturing: 1 (-9)
Empire State manufacturing: -11.2 (4.5)
Dallas Fed manufacturing: 9.7 (0.8)
Manufacturing PMI:1 46.2 (47.7)
Service PMI:2 44.2 (46.2)
Consumer Confidence:3 108.3 (101.4)
Eurozone, December (November)
Manufacturing PMI:4 47.8 (47.1)
Service PMI:5 49.1 (48.5)
China, October (September)
Caixin manufacturing PMI:6 49.4 (49.2)
NBS manufacturing PMI: 48.0 (49.2)
Caixin service PMI:7 47.6 (48.4)
Disclaimer:
The information contained herein is current as at the date of this entry. The information presented here is considered reliable, but its accuracy is not guaranteed. Changes may occur in the circumstances after the date of this entry and the information contained in this post may not hold true in the future.
No information contained in this entry should be construed as investment advice. Readers should always consult their own personal financial or investment advisor before making any investment decision, and readers using this post do so solely at their own risk. Readers must make an independent assessment of the risks involved and of the legal, tax, business, financial or other consequences of their actions. GnS Economics nor Tuomas Malinen cannot be held i) responsible for any decision taken, act or omission; or ii) liable for damages caused by such measures
Values above 50 indicate growing output, while values under 50 indicate declining output. Figures were obtained from TradingEconomics.
From TradingEconomics.
The Conference Board.
From TradingEconomics.
From TradingEconomics.
From TradingEconomics.
From TradingEconomics.


