Contents:
Oil prices in historical perspective.
The stochastic trend in the price of oil.
Forecasting the price of oil.
This week, before our summer break, we launch our forecasts for the price of oil. This is directly related to the investment company we have set up, but these forecasts are also something we should have probably done already earlier.
We build our forecasting model using the concept we unveiled last week. The two data series we are using, Brent spot price (European crude) and month-ahead WTI (U.S.) crude oil futures contract, bring some surprises. At the end, we are able to build a model that performs satisfactorily (at the statistical level).
Our first, and preliminary, forecasts indicate a price pressure building below the falling oil prices. We also build a scenario forecast, modeling the combined effect of an oil shock and a U.S. recession. Results are interesting.
Weekly Forecasts will now take a break of four weeks. We will pause the billing for this period, starting on the 1st of July, after our summer offer expires on the 30th. This means A) if you’re a free subscriber, you still have time to reclaim our offer, and B) if you are or become a paying annual subscriber, four weeks will be added to your annual subscription, and C) monthly subscriptions will not be charged during the next four weeks (essentially every subscription is pushed forward for four weeks).
I wish you a joyful and relaxing summer!
Tuomas
Oil prices in historical perspective
As you are familiar by now, we start by visually assessing the time series of Brent (European) Crude and WTI (U.S.) Crude benchmark indices. The data we use (from MacroTrends) includes the Brent spot price (European crude) and the month-ahead WTI crude oil futures contract. In essence, what we use are the physical spot price benchmark for North Sea crude in the European/global market (Brent) and the WTI Crude oil futures contract traded on NYMEX (New York Mercantile Exchange). Figure 1 presents their monthly values from January 1979 (WTI) and from May 1987 (Brent) with major shocks until 24 June 2026.
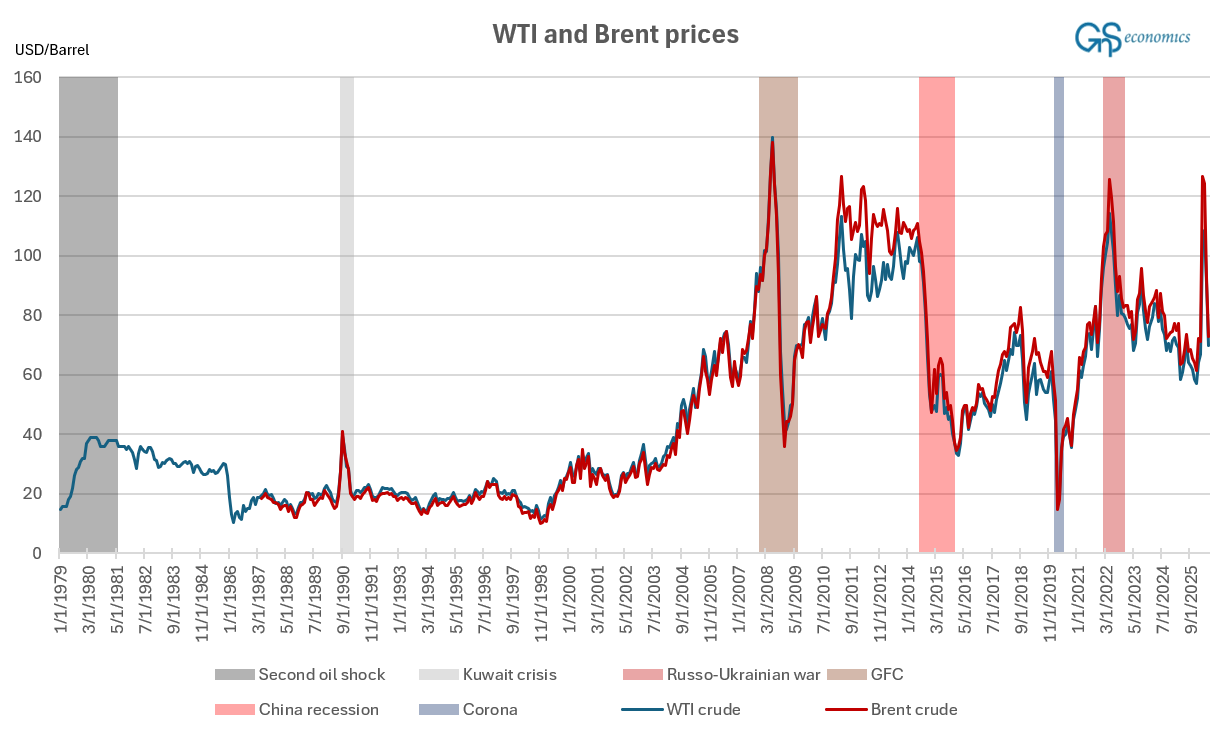
What we first notice from Figure 1 is the co-movement of the two series. This is, of course, as it should be, because both the spot price and month-ahead futures prices of oil should not drift far apart. However, there was a notable divergence between the two soon after the Great Financial Crisis. This is attributable to the shale oil boom of the U.S., which overwhelmed the local demand and takeaway capacity, leading to the unusually long divergence in the two benchmarks.1
We have also marked the drivers, or shocks, behind major price moves in the respective prices of Brent spot and WTI futures. The second oil shock (note that the U.S. government “decontrolled” the prices only at the end of January 1981) and the Kuwaiti crisis led to notable jumps in their respective prices. However, a major (permanent) increase in the oil prices occurred during the global economic boom that emerged after the collapse of the Dot-com bubble and the recession that followed. This pre-GFC rise in the price of oil is mostly attributable to the rapid growth of the developing economies (especially the rise of China) while global production remained stagnant.2 Other factors behind it were the weakening U.S. dollar and increased financial market speculation.
Oil prices saw a major collapse during the GFC, then recovered, only to collapse in the wake of China’s (hidden) recession in 2015 and the shale oil boom coming into fruition (capacity restrictions easing). The first Corona lockdowns naturally led to another drop in the price, and the commencement of the Russo-Ukrainian War caused a spike in the prices.
Figure 1 also depicts the exceptionality of the current situation in the oil markets. First, both spot and futures prices spiked, as they should in the face of the biggest oil shock ever, but then dropped like a stone. Such a price response would be justified only if the global economy had fallen off the cliff, which it clearly has not done, yet.
There’s quite a lot of evidence suggesting the manipulation of the oil markets. For example, a historical gap has emerged between U.S. gasoline prices and WTI (future) prices due to massive short positions. Traders have also been frequently “burned” by the jawboning of President Trump to push the prices lower (insider-trading claims have also been raised). Manipulation of the oil market is thus the likely culprit behind its ‘uncanny’ behavior.
What we have essentially described above is a structure of shocks affecting the oil prices and therefore their statistical dynamics and the (possible) equilibrium relationship. In other words, the multitude of shocks carrying profound effects in the series of Brent spot and WTI futures is something we need to address in our statistical analysis, to which we turn now.
The stochastic trend in the price of oil
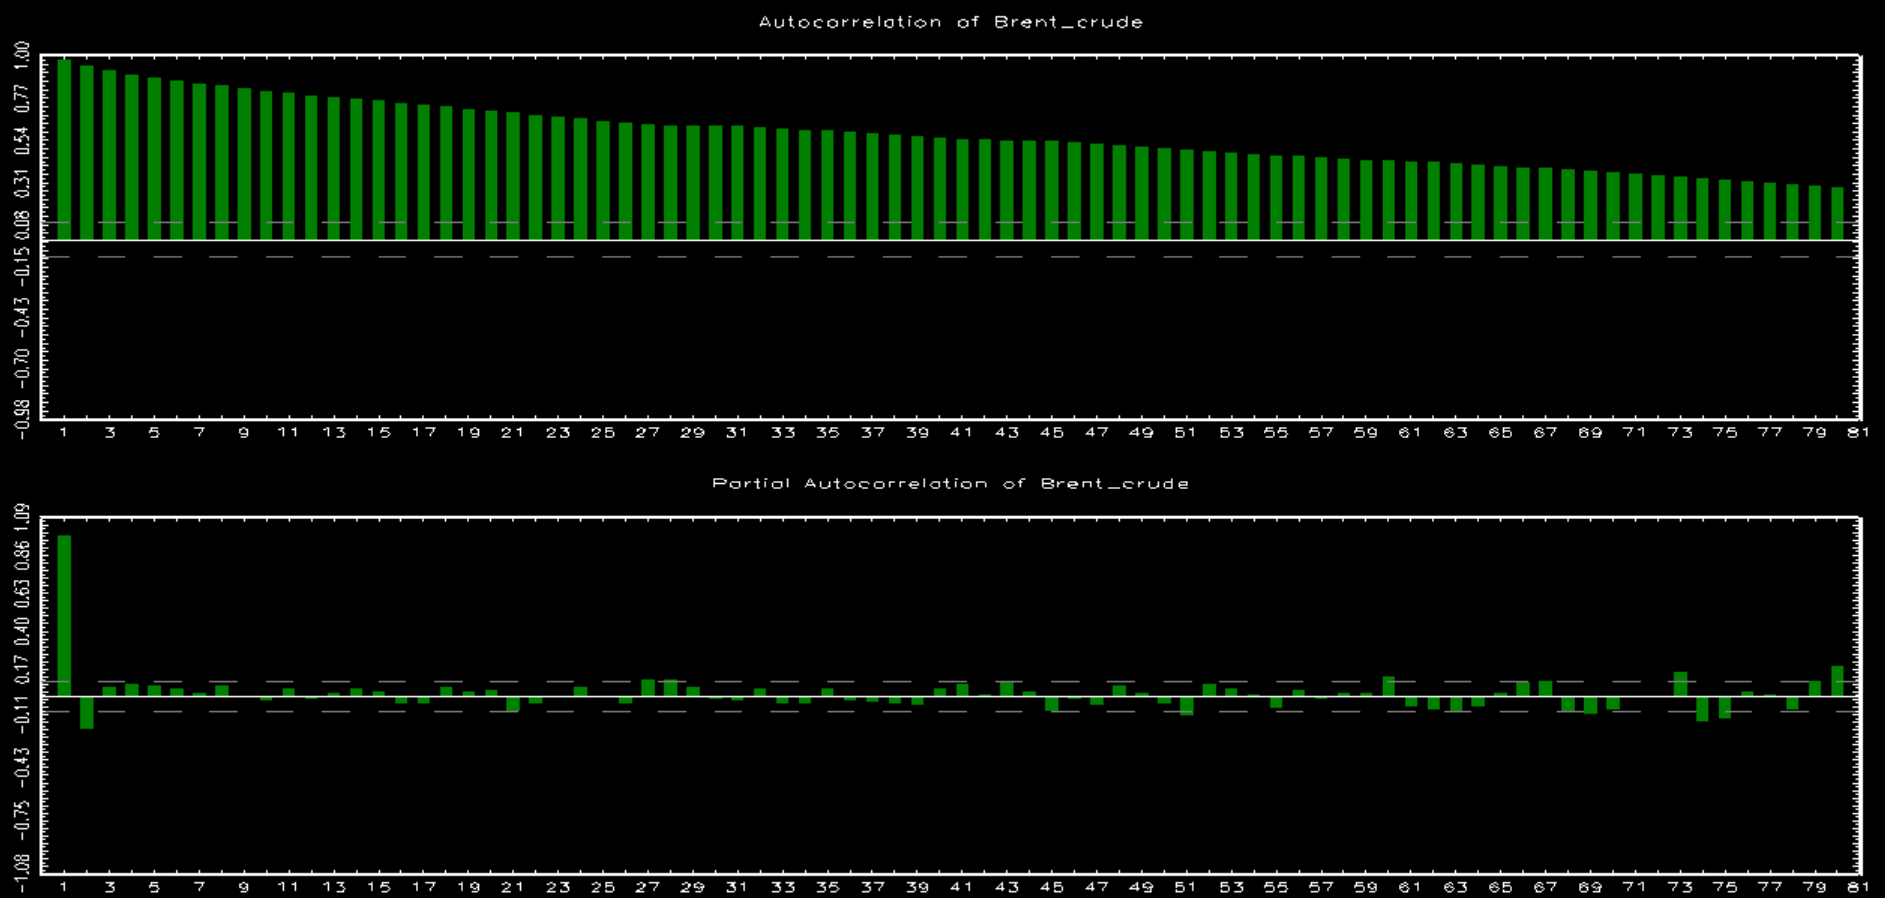
As usual, after the visual inspection, we proceeded with testing of the statistical properties of the two series. Figure 2 presents the autocorrelation and partial autocorrelation functions of the Brent Crude (European) spot.